DTrace on Windows (Dynamic Tracing framework) allows viewing a real-time summary in user or kernel mode to detect and exact errors. You can see the details of DTrace.exe here. A new version of the tool is available to download for Windows 10 2004 build 19041.21 and greater with some features and fixes. The package cannot be installed on Windows 10 v1909.
DTrace for Windows 10 2004 removed the requirement for the kernel debugger. The kernel currently relies on “VBS/virtualization based security” to safely enter dynamic trace points into the code. You are able to insert dynamic trace points without disabling PatchGuard securely and reliably. Important to know that enabling the kernel debugger disables PatchGuard.
DTrace on Windows for Windows 10 2004 build 19041.21 and greater
See how can you use DTrace on Windows –
1] Enable boot option to turn on DTrace
2] Download and install the DTrace MSI.
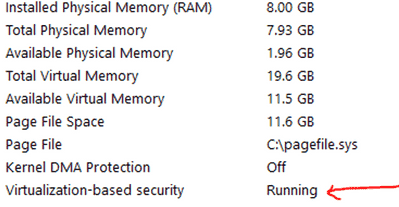
3] Ensure VBS is turned on
4] Optional: Update the PATH environment variableto include C: \ Program Files \ DTrace
set PATH =% PATH%; "C: \ Program Files \ DTrace"
5] Setup symbol path
- Create a new directory for caching symbols locally. Example: mkdir c: \ symbols
- Set _NT_SYMBOL_PATH = srv * C: \ symbols * https: //msdl.microsoft.com/download/symbols
- DTrace automatically downloads the symbols necessary from the symbol server and caches to the local path.
6] Reboot machine
To ensure whether VBS is activated, call msinfo32.exe. The entry can be located under System overview.

Download DTrace on Windows – Official Microsoft page.
See development on Github.
That’s all!!!
