Main work of the Windows Performance Analyzer program is to trace logs events usually for the purpose of troubleshooting. The application creates the event trace log report table and graphical visuals to enable users to track down the potential issues. Thus, it provides the necessary data and ensures every user comfortably blocks the recurrence of detrimental system errors. Usually, Windows Performance Recorder or else performs the recording of event trace logs. This is a generic part of the Windows ADK program commonly well known as Windows Assessment and Deployment Kit.
Windows Performance Analyzer has an extraordinary UI that offers one-shot access to programs like Diagnostic Console, Graph Explorer, Issues Window, Analysis Tab, and many more. The program is basically useful while analyzing the Operating system of your machine. You can easily check the memory status, power source stability, system activity log thus you can get information about the part of your Windows that is insecure.
Way to use Windows Performance Analyzer
Here is How to Use Windows Performance Analyzer in Windows 11 or 10 –
Step-1: Download Windows Performance Analyzer from Store
Windows Performance Analyzer is available in Microsoft Store now so go to this link and download the tool.
Step-2: Open a Trace file
To open a trace file, choose File>Open.
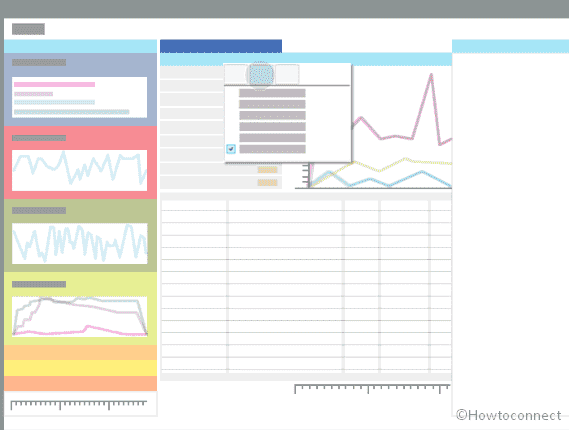
When you open a trace file, events are categorized in Graph Explorer on the left, and the Analysis Assistant opens in the pane on the right. The Analysis tab is in the center.
Step-3: Configure symbols
After a trace file is loaded, choose File>Configure Symbols to control the processes and images that have symbols.
Symbols must be loaded correctly for all the data to appear in the Analysis tab. Choose File>Load Symbols after the settings are configured.
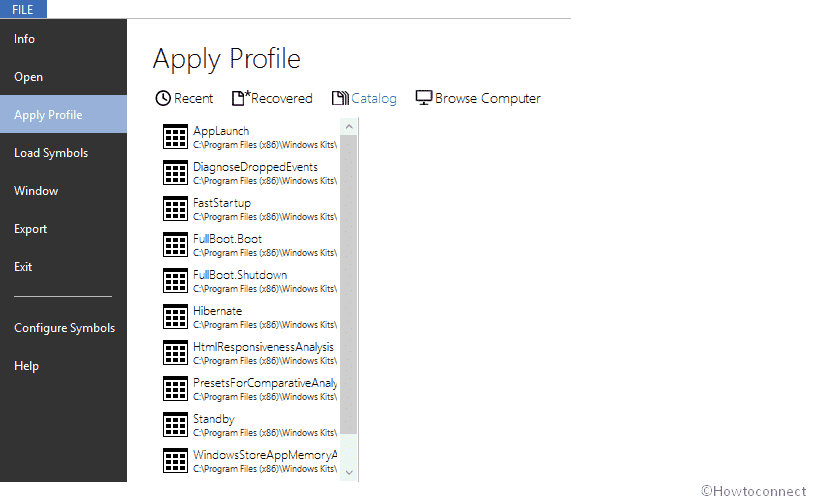
Step-4: Apply a profile
Profiles optimize the information displayed in the Analysis tab.
Choose File>Apply Profile>Catalog, and then select a profile applicable to your analysis.
Step-5: Add graphs to the Analysis tab
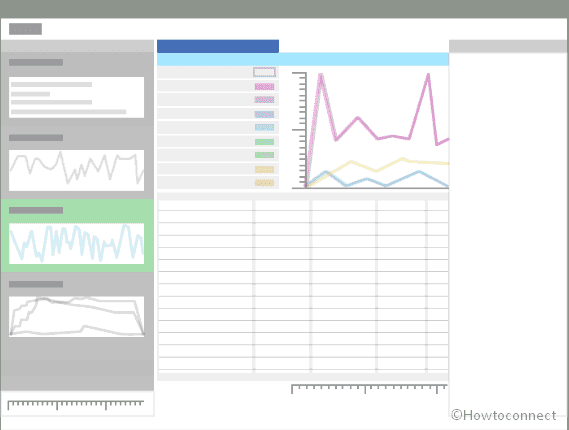
Graph Explorer lists the available graphs.
Drag a graph to the Analysis tab to start your performance analysis.
You can also double-click a graph to add it to the Analysis tab.
Basic Actions
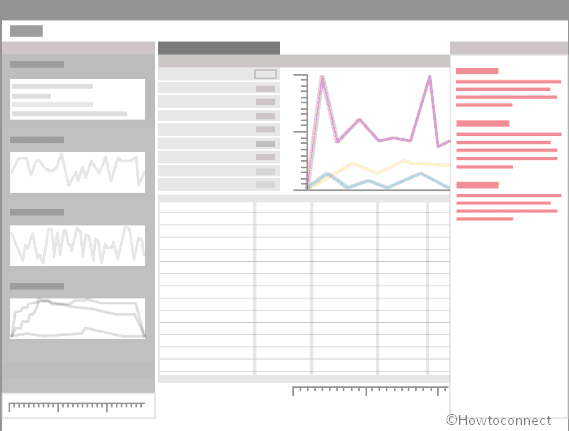
Use the Analysis Assistant
Analysis Assistant provides useful information about the profile, tab, graph and preset. When you select a specific graph or data table, information about that specific graph and table is shown in the Analysis Assistant. Use this as a guide during your analysis.
Highlight a time interval
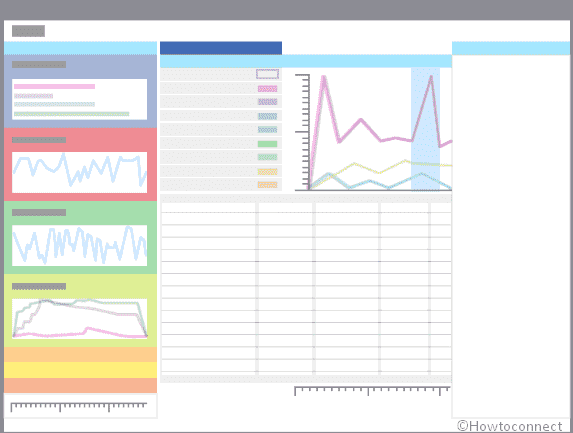
Click and drag the mouse pointer over a time interval on the graph where system activity indicates a potential performance issue, for example, high CPU usage. Information in the table will sync to your selection.
Zoom, Search and Filter
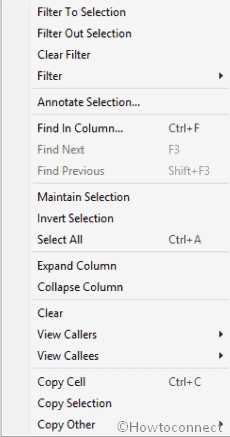
In the Data table, select and right-click on a row to filter the data that is displayed in the table.
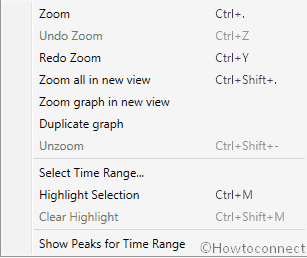
Select an area in the graph and then right-click and select Zoom.
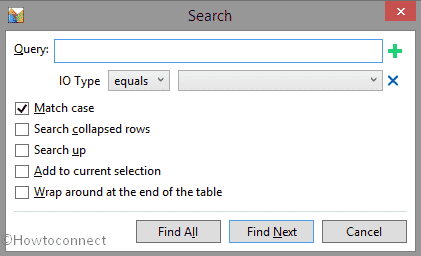
Press Ctrl+F to search for data.
View Data
Graphs
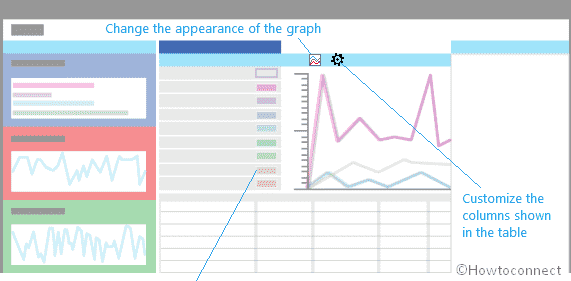
Graphs are the primary way to visualize the recorded data. The style of the graph is dependent on the type of data.
Data Tables
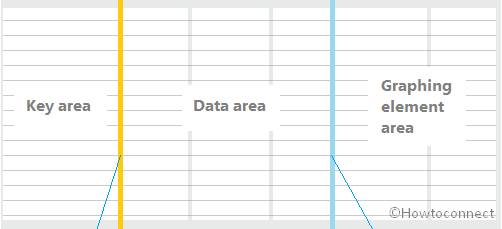
The data from your trace log file is also available in tabular form, in the data table. It is divided into three areas: keys, data and graphing.
Customization
You can customize any data table by right-clicking on the columns and adding more columns. Once required columns are added, save the changes to allow faster repeat analysis.
That’s all!!
