When your PC performance is not upto mark you need to find out the real cause that affects its resources normal behavior. Windows is a tool rich OS as multiple built-in tools continuously monitor CPU, Memory, Disk, and Network of a computer. So when you analyze resource values, Task Manager helps you out with the correct data of usage in numeral and graphical view.
You can analyze resources performance in Task Manager Windows 10 easily. Task Manager shows CPU Utilization, Disk details, and memory usage with a bunch of information. So the only job left for you is to reach here and decipher them whether which process is consuming more memory or disk or network.
How to Analyze Resources Performance In Task Manager
Since the Task Manager provides the details of the Memory, CPU, and Disk consumption so we will explain them one by one. For this, you need to open it first.
Open Task Manager
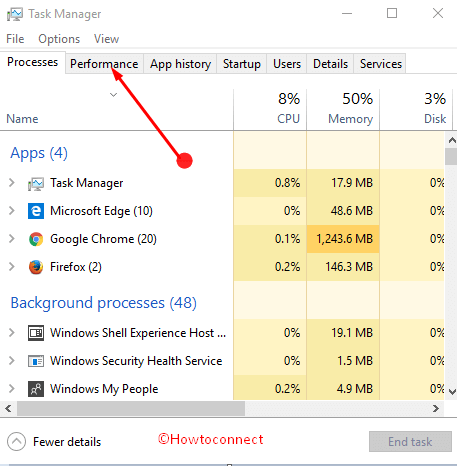
Step 1 – Press the shortcut combination “Control + Shift + Escape” on the keyboard and let the “Task Manager” open. By default, it will appear with the “Processes” tab, switch to Performance.
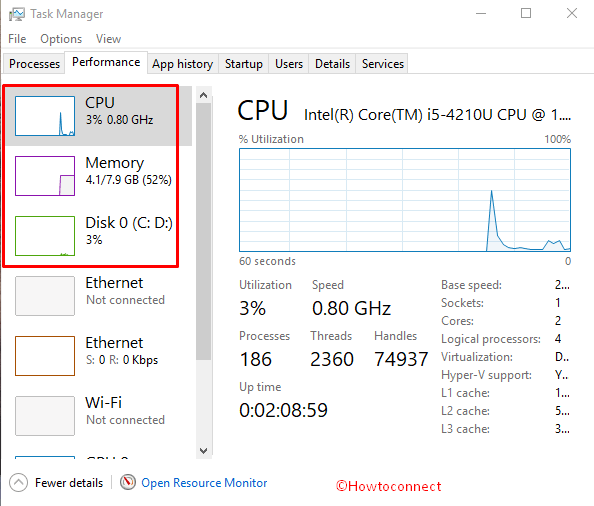
Step 3 – You find CPU, Memory, Disk, and Networks you are connected to in left pane. Each resource will display the whole information about the situation of usage.
1. CPU
When you select CPU from the left pane, you notice a graph for %Utilization of CPU showing spikes. The line in the graphical view represents the cores used by your Windows system over 60 seconds.
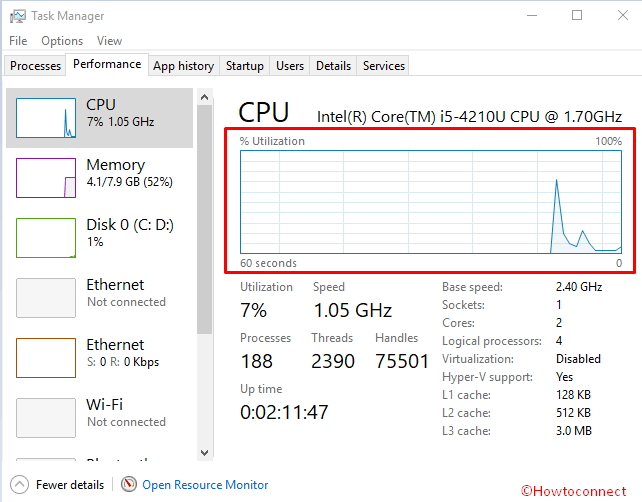
CPU %Utilization refers to its percent involvement for doing all the tasks processing on your system. Suppose your CPU is single core with the set 2.0 Hz frequency and completes 1 billion cycles worth of work in a second. So when the graph is showing 40% then the core consumes 40 percent of its capacity in that second.
Hence, you get an exact idea CPU usage to analyze resources performance in Task Manager Windows 10.
How much CPU usage is Good?
So far as the question of what percentage of CPU usage is good or bad there is not a fix limit. You may notice a jump in the graph when gaming, upto 100%. Normal CPU usage is 2-4% when system is idle. When working with browser simply it’s about 10%, 20-25% while running office application and so on. So the data fluctuates now and then depending on the processes you are doing and it is not the matter of concern. You need to take care of the CPU temperature if the performance of your system is troubling.
More Information – In addition, you can see here Speed, number of Processes running presently, Threads, Handles, and Uptime. These data help you to understand the CPU utilization of your system more precisely. Some more information like Base speed, Sockets, Cores, Logical processors, etc are available in the bottom section.
2. Memory
When you click on the Memory in the left pane the detailed information of the physical memory usage comes into view in the right pane. The graph displays what is the Utilization percentage of your RAM over 60 seconds of current time.
You find one more graph here providing the information of Memory Composition. This implies the memory part engage in processes, drivers, or the operating system.
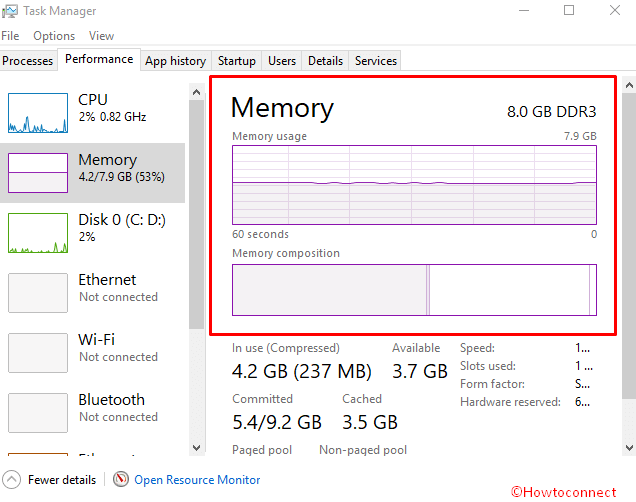
Apart from this, Committed, Cached, Paged pool, Non-paged pool are available in the bottom part.
In Memory section, you find the graph line remains almost still. When you open a new application the usage increases with certain percentage and decreases when close. It means more space of the memory is occupied by the application when you launch and evacuated when close. Memory includes the Committed and Cached data of system furthermore, Paged pool and Non-paged pool.
How much is Normal Memory usage?
It again depends on the RAM your PC is installed moreover, the number of applications you are running currently. But normally 30-40% is a better data of memory usage at idle you can be satisfied with. Although a jump in the memory usage graph for a short period doesn’t matter. But you need to seriously think to add more RAM in slots if it remains over 60-70% consistently.
3. Disk
The Disk in task manager gives important information regarding hard drive usage. You find two graphs here – one for Active time and another for Disk transfer rate. Both present the disk consumption over 60 seconds of time.
Active time indicates the time spent for the sake of “reading from” or “writing to” physical drives. Disk transfer rate shows the speed by which the data are copied from a system to the drive in the 60 seconds timeframe.
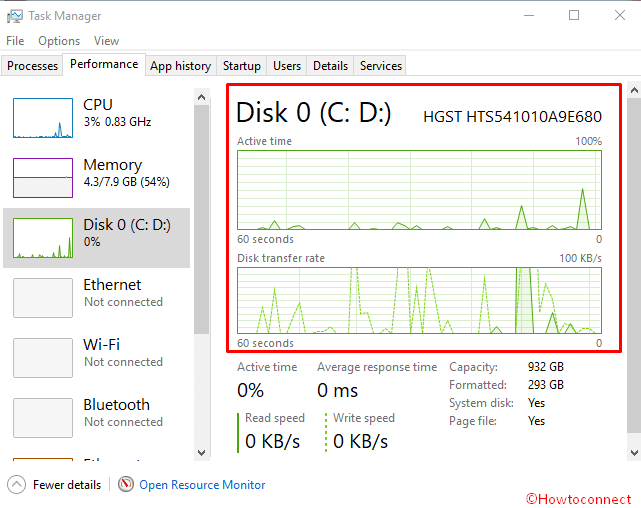
The lower part displays the same information in detail including Average response time and Read and Write speed. Besides, you find Capacity, formatted, system disks, and page file values and situations.
So Disk usage of the system in live report helps you to analyze resources performance in Task Manager Windows 10. Now the question is
What should be the Disk usage percentage?
It again depends on the total Disk space available on your computer and the task you are processing. But in normal circumstances, when your system is idle the consumption is around 2-4%. I have 1TB hard drive and while working with browser I find it between 0 to 10 percent.
Conclusion
So this is how you will analyze resources performance in Task Manager Windows 10. Once you are satisfied then it’s OK otherwise you can use different tools like Performance monitor, Reliability monitor, Disk checking command to deeply dig out the more information.